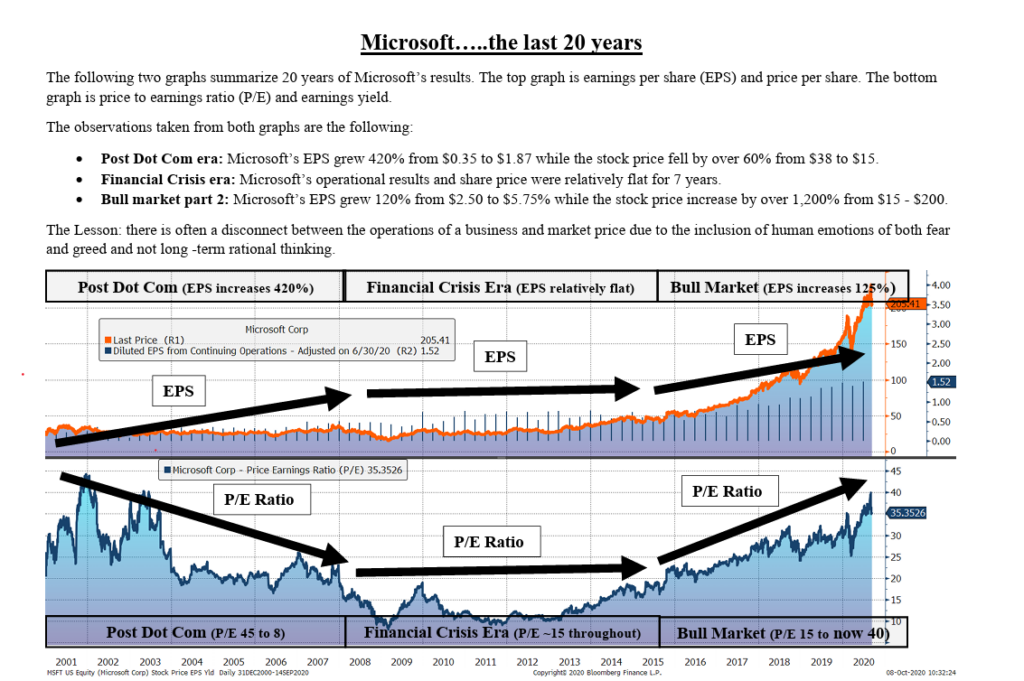
The following two graphs summarize 20 years of Microsoft’s results. The top graph is earnings per share (EPS) and price per share. The bottom graph is price to earnings ratio (P/E) and earnings yield.
The observations taken from both graphs are the following:
• Post Dot Com era: Microsoft’s EPS grew 420% from $0.35 to $1.87 while the stock price fell by over 60% from $38 to $15.
• Financial Crisis era: Microsoft’s operational results and share price were relatively flat for 7 years.
• Bull market part 2: Microsoft’s EPS grew 120% from $2.50 to $5.75% while the stock price increase by over 1,200% from $15 – $200.
The Lesson: there is often a disconnect between the operations of a business and market price due to the inclusion of human emotions of both fear and greed and not long -term rational thinking.