Growth Expectations Often Overly Optimistic
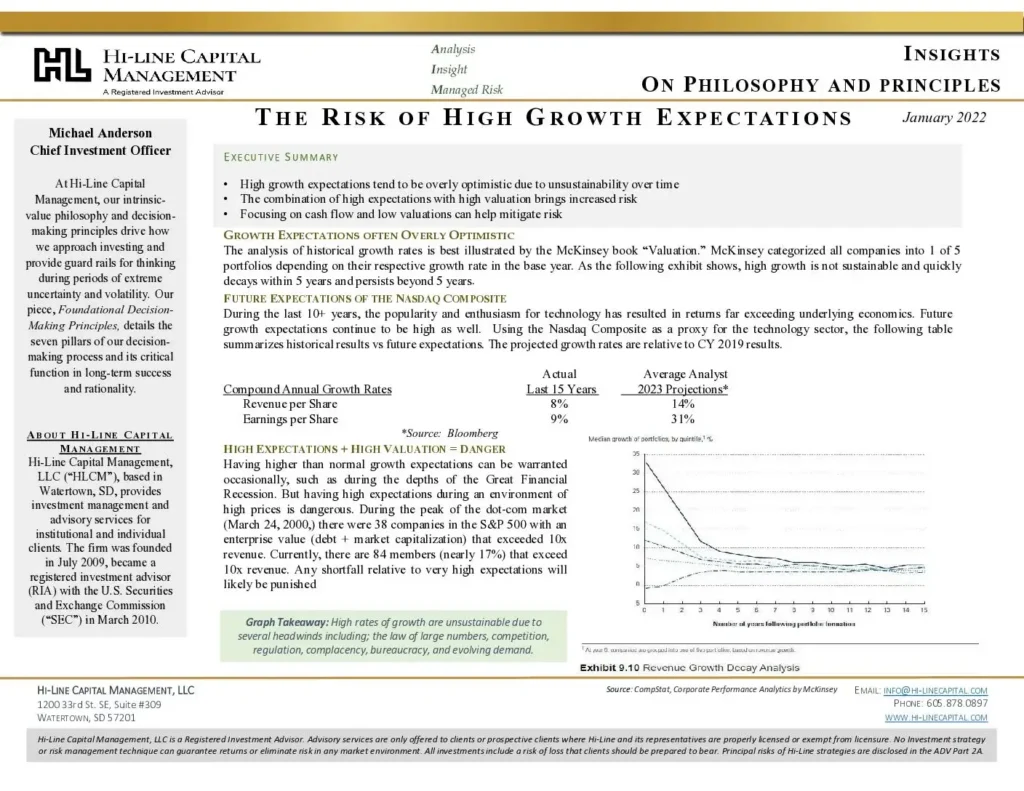
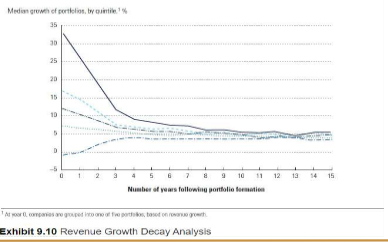
The analysis of historical growth rates is best illustrated by the McKinsey book “Valuation.” McKinsey categorized all companies into 1 of 5 portfolios depending on their respective growth rate in the base year. As the following exhibit shows, high growth is not sustainable and quickly decays within 5 years, but persists beyond 5 years.
Future Expectations of the Nasdaq Composite
During the last 10+ years, the popularity and enthusiasm for technology have resulted in returns far exceeding underlying economics. Future growth expectations continue to be high as well. Using the Nasdaq Composite as a proxy for the technology sector, the following table summarizes historical results vs future expectations. The projected growth rates are relative to CY 2019 results.
| Compound Annual Growth Rates | Actual Last 15 Years | Average Analyst 2023 Projections* |
| Revenue per Share | 8% | 14% |
| Earnings per Share | 9% | 31% |
*Source: Bloomberg
High Expectations + High Valuation = Danger
Having higher than normal growth expectations can be warranted occasionally, such as during the depths of the Great Financial Recession. But having high expectations during an environment of high prices is dangerous. During the peak of the dot-com market (March 24, 2000,) there were 38 companies in the S&P 500 with an enterprise value (debt + market capitalization) that exceeded 10x revenue. Currently, there are 84 members (nearly 17%) that exceed 10x revenue. Any shortfall relative to very high expectations will likely be punished.
Graph Takeaway: High rates of growth are unsustainable due to several headwinds including; the law of large numbers, competition, regulation, complacency, bureaucracy, and evolving demand.
Risk Mitigation
Securities with low prices relative to earnings or cashflow generally have low growth expectations. Companies with low or negative expectations revert towards the median growth (see chart.) Potential exists for dual tailwinds, growth above expectations, and prices relative to earnings increasing. Price is the best tool to mitigate risk.
Equity Indexes – Rational Expectations
Equity market returns of the past 10 years have exceeded the underlying economics and were primarily aided by lower interest rates. If interest rates stay near current levels, the proper expectation is for future returns to be closer to underlying economics. If rates rise, the equity index return may be less than underlying economics.
At the end of 2021, the annual compound returns of the Dow Jones Industrial Average since 1900 was near 8.8% annually comprised of price appreciation averaging 5.3% (reflects combination of earnings growth and share count reduction) and an average dividend yield of 3.5%. The returns of the past 10 years have been much higher. The recommended return expectations for the next 10 years should be lower as outlined by the following table.
| Price Appreciation | Actual Since 1900 | Actual Last 10 Years | Rational Expectations Next 10 Years |
| Dividends | 5.3% | 13.8% | 4.0% – 6.0% |
| Returns | 3.5% | 2.2% | 1.5% |
| 5.5% to 7.5% | 5.5% to 7.5% |
The future return expectations for equity indexes should be much lower than recent past results due to:
- Lower dividend rates;
- Lower price appreciation due to more reasonable growth expectations;
- Lower price to earnings due to the probability of rising interest rate.
All the above collectively determine total prospective returns.